Non-compliant build
Open CodePipeline in the Management Console. You will see a CodePipeline that starts with aqua-devsecops. Click the link to view the details.
Once you are on the details page for the specific CodePipeline, you can see that a new CodePipeline has already been triggered.
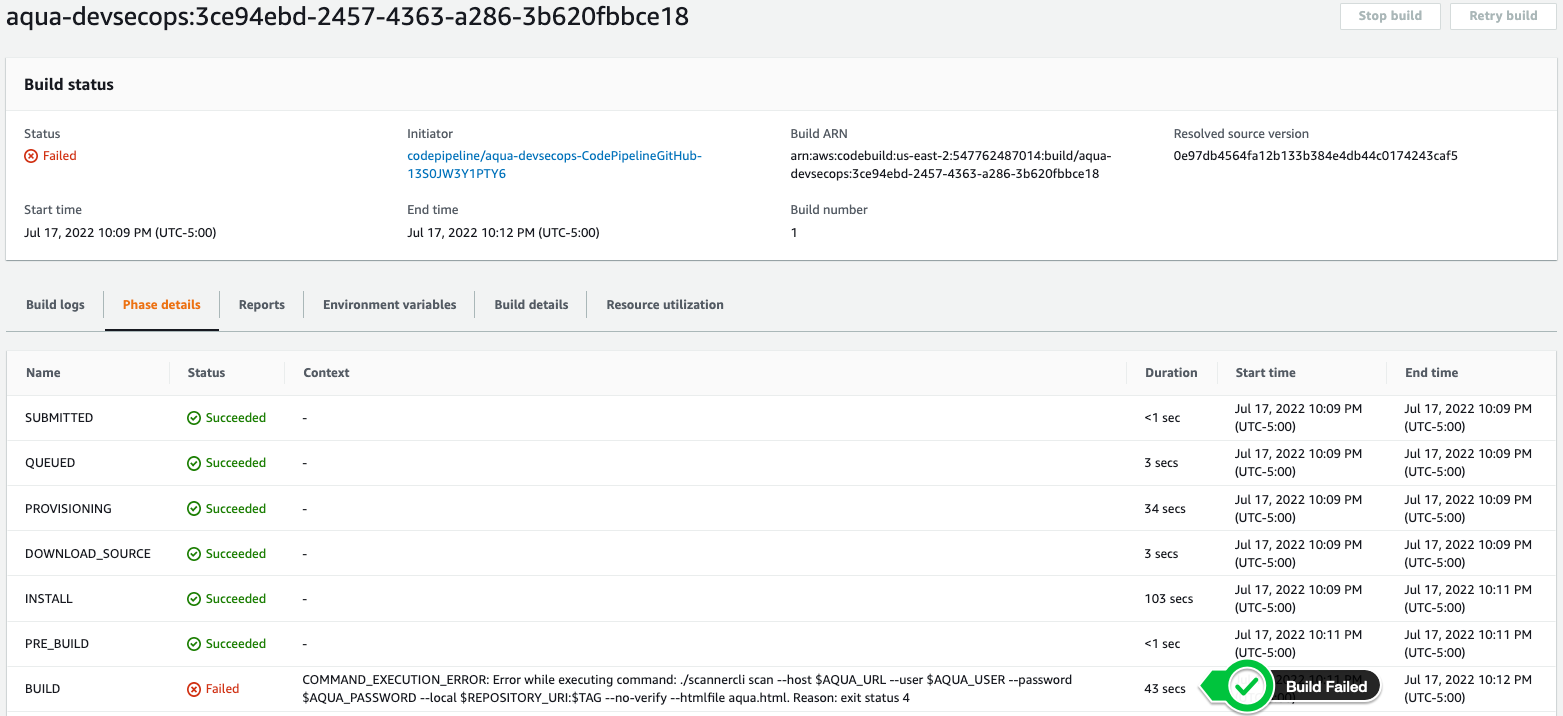
Notice the pipeline fails during the Build phase because of the Aqua scanner step with a Build error below, in the CodeBuild Phase details.

You can also check out the Phase Details in the CodeBuild project to see that the Aqua scanner step has failed.
Aqua scanner generates a report from the automated scan which is saved as an aqua.html artifact in the CodePipeline artifact location. This can be retrieved by clicking on Build details tab in the CodeBuild console and scrolling to the Artifacts section.
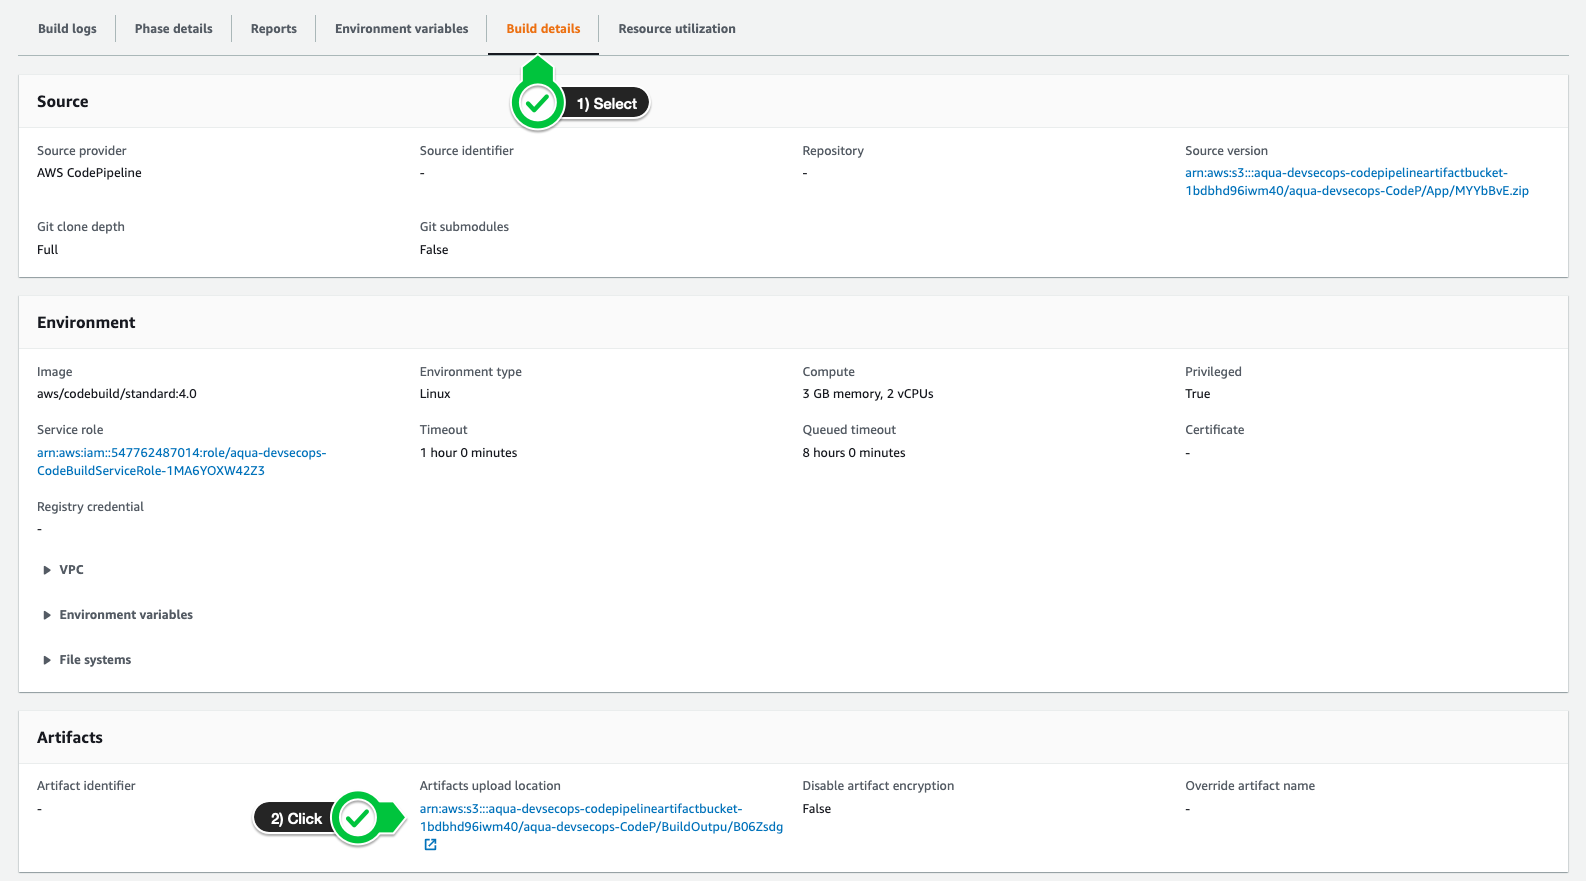
Click on the Artifacts upload location, download the zipped artifact file and extract the aqua.html file. Aqua provides an HTML output outlining the root cause of pipeline failure based on the assurance policies you defined previously.
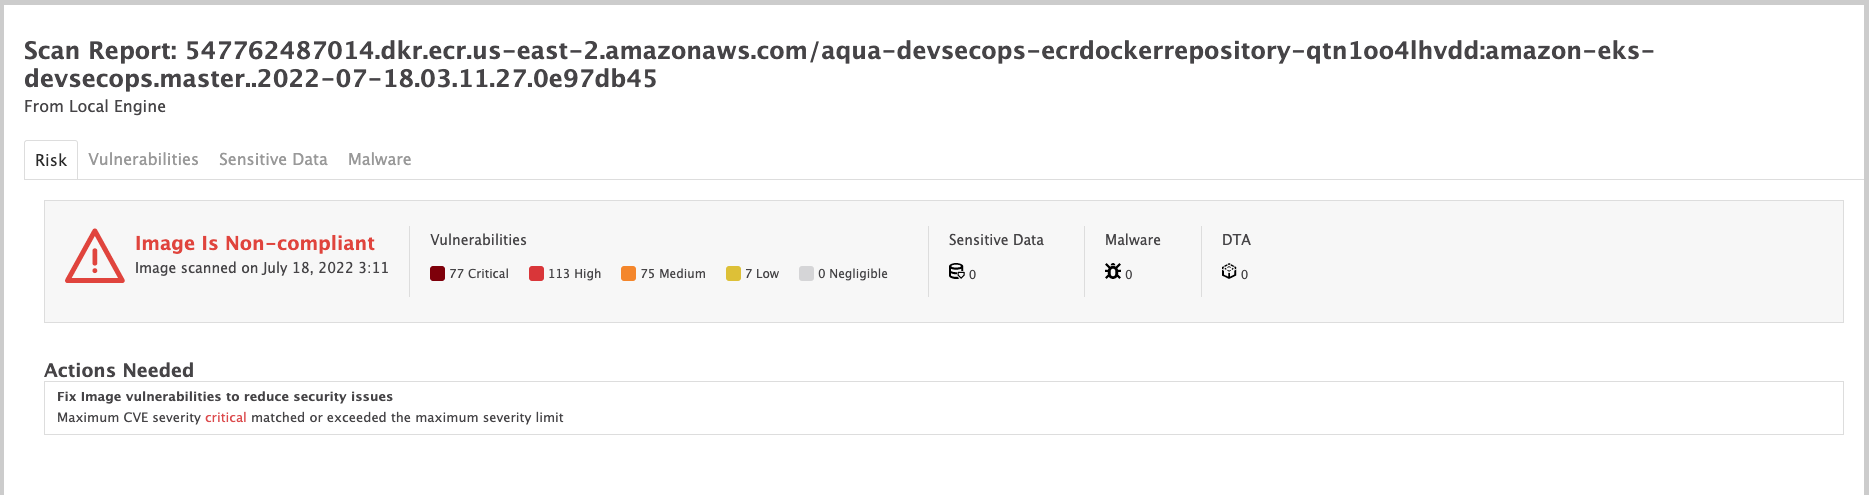
Clicking on the Vulnerabilities tab also shows the various vulnerabilities that were detected in the image, and whether a fix is available.

You can also go to the Aqua Console and view the details of the non-compliant image.
